

What is Normal?
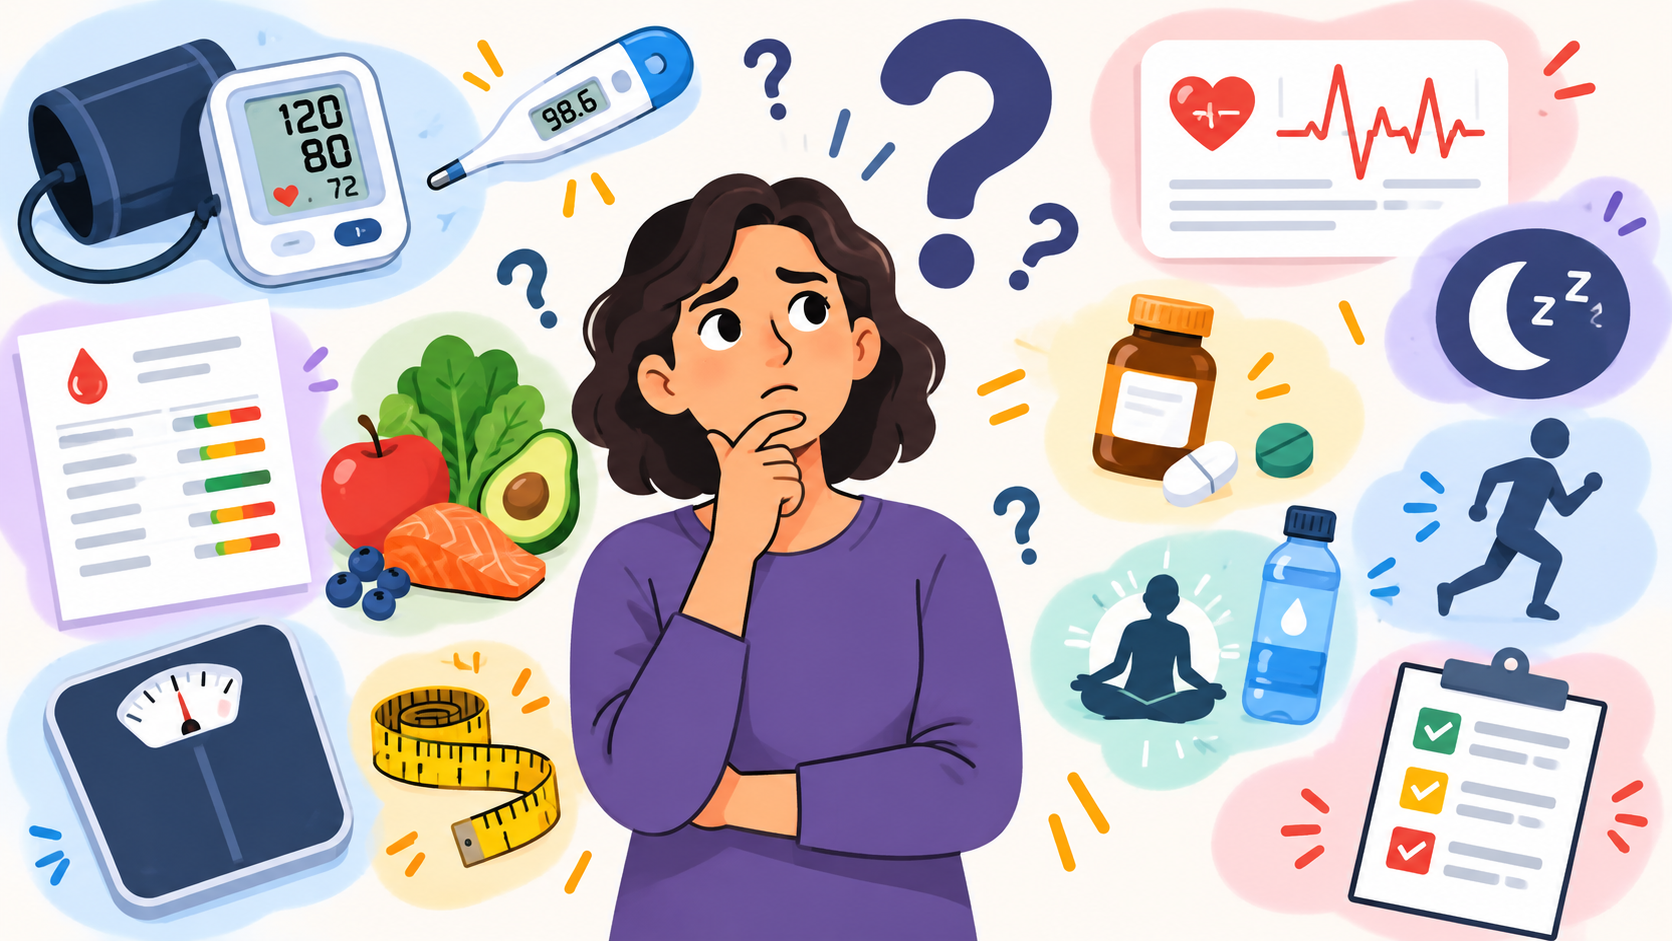
You hear it all the time. “Everything’s normal.” “It’s within normal limits.” “You’re fine.” “My labs are all in the green range.”
Your doctor just gave you the OK to keep doing what you’re doing. But is this really healthy? Are you truly “good?” Not quite.
A number can be statistically normal without representing your best interest in health. If anything, I see it time and time again where laboratory results can be in range while the bigger picture is moving in the wrong direction.
Today’s topic tackles complacency, the silent grim reaper that takes away years of your life under the guise of someone saying “it’s fine!” The ultimate goal of longevity is to set yourself up for success—to preserve function, independence, and the ability to keep doing what matters to you.
By the end, I hope you’ll be able to answer: What is normal for me?
Key Objectives
Understand Measures of Central Tendency: mean, median, and mode—and why the people you compare yourself to matter.
Recognize the difference between common age-related changes and loss of function that is reversible vs irreversible.
Choose realistic, evidence-based goals rather than blindly accepting “average.”
Learn practical reference values for fitness, nutrition, body, and metabolic health.
Understand why trends, trade-offs, and personal circumstances matter more than any single number.
When Unhealthy Becomes Normal
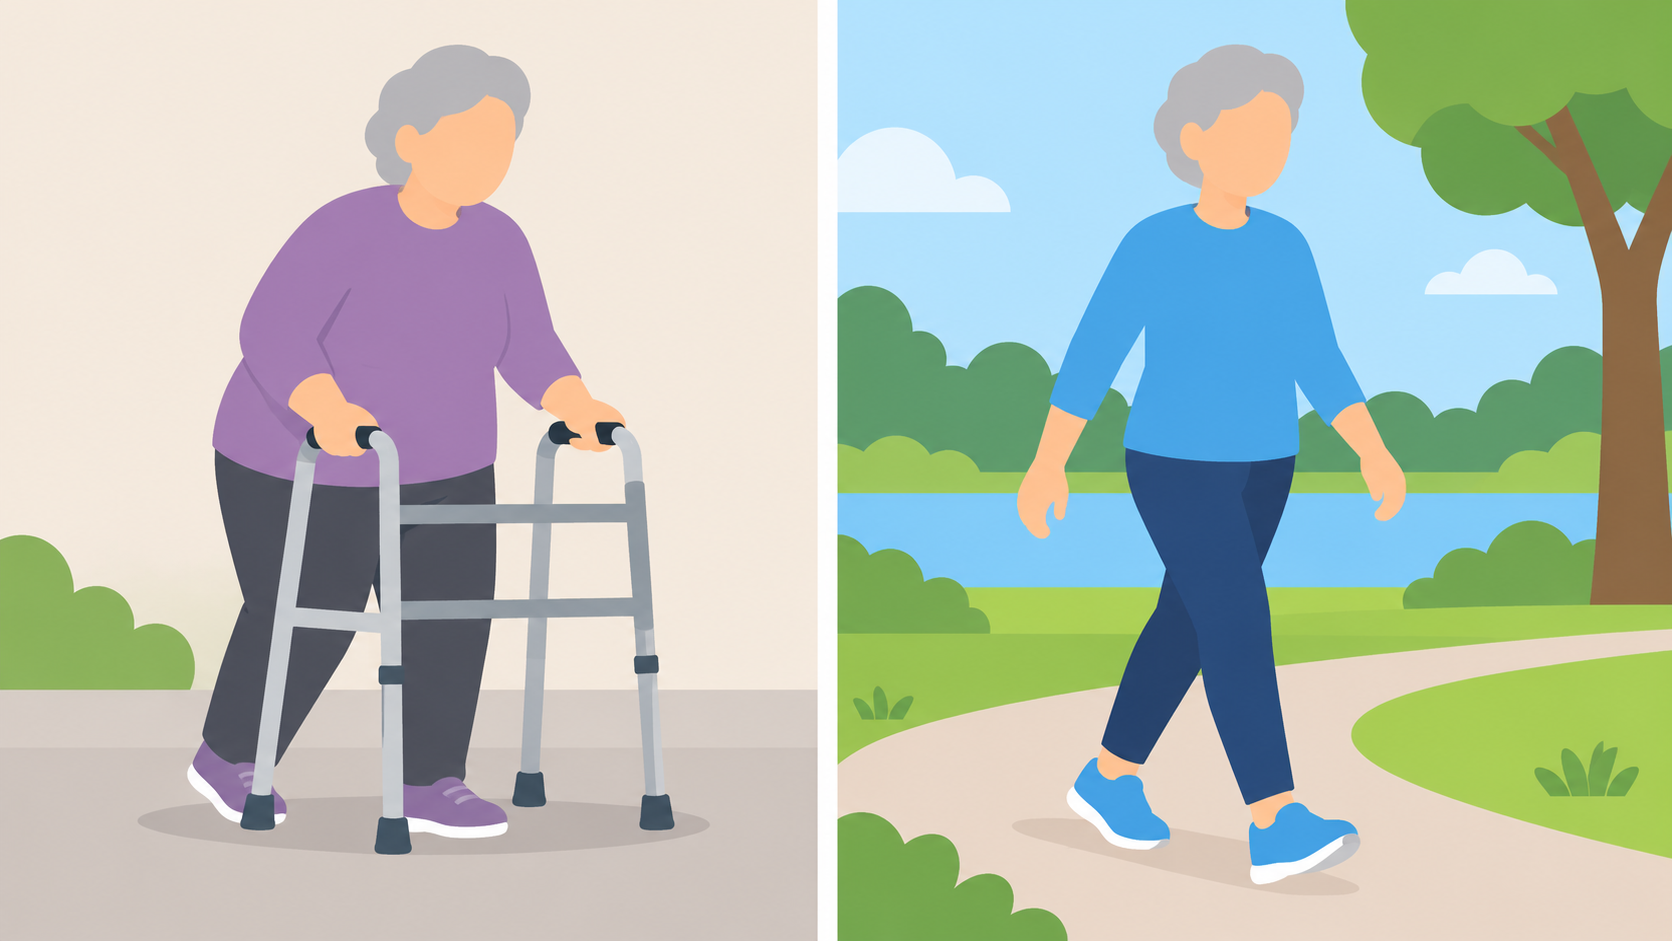
Picture an elderly person—perhaps your grandparents—moving slowly, struggling to stand, or worrying about losing their balance. Here in the United States, we’ve normalized this expectation. We expect “old” to mean weak and frail. We have a vision of our grandparents sitting in recliners watching TV all day; even walking to the mailbox is risky. We can’t really imagine an 80 year old knocking out pull-ups, push-ups, and squats here in the US.
If you’ve been my patient, you’ll remember me saying: Old is a disease. It’s not normal. We all age, but we all have the option to age gracefully. My point is that we shouldn’t assume every loss of function must happen simply because someone has another birthday.
Muscle loss. You’ll read reviews describing losses of approximately 3–8% of muscle mass per decade beginning in adulthood, with a faster decline later in life. Adding insult to injury, muscle strength declines faster than muscle mass. (1–3)
So if I gave you two examples, someone that doesn’t work out at all versus someone that works out every day, who do you think will have more muscle mass and strength by 80 years old? Obviously the one that worked out.
The key is that your body adapts to the demands placed on it. Too quick, injury. Too slow, no gains. If you never ask your muscles to carry, climb, squat, or fight resistance, the stimulus to maintain strength shrinks. Bones respond to this mechanical loading, so strictly speaking if you don’t build muscle, you don’t build (or maintain) bone.
Fortunately, this process is modifiable. A Cochrane review of randomized trials found that exercise reduced the rate of falls by approximately 23% in community-dwelling older adults. Balance and functional training were especially valuable.(4) Personally, at my last practice I remember three of my >90 year old patients that used to be in wheelchairs 3 years prior to me being their doctor and through extensive exercise programs, we were able to get them strong enough not to require them after about a year. Seriously, it works!
So understand that sometimes what we think of as normal may actually be the lowest bar of health.
Your Environment Helps Define Your “Normal”
I have family in Hong Kong and family in Ohio.
It’s interesting how different the expectation of aging can feel in two places.
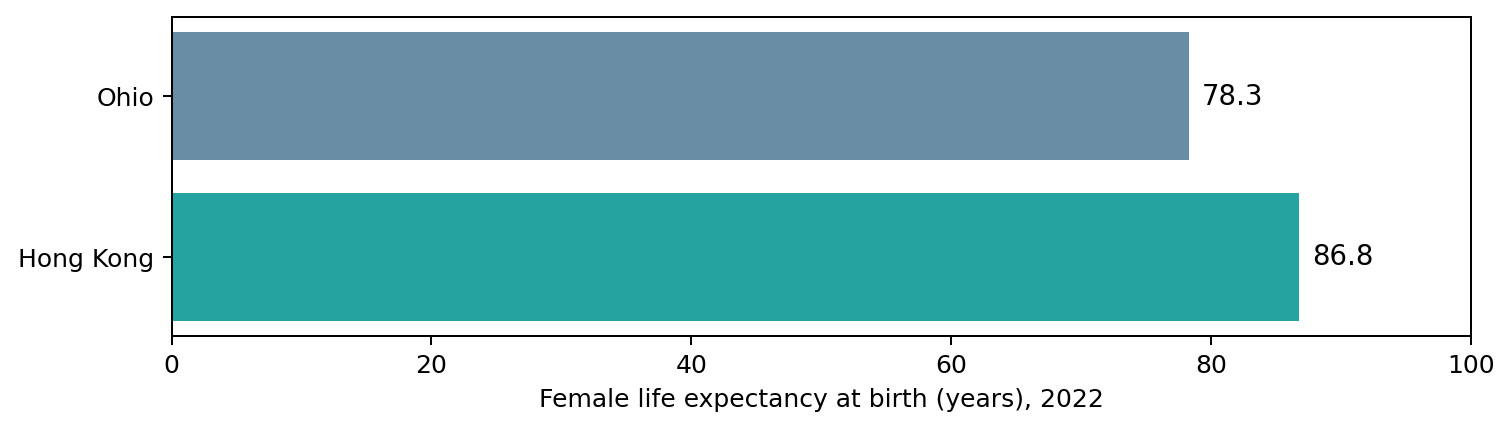
Figure 1. Same-year female life expectancy at birth, CDC and Hong Kong Census and Statistics Department. Higher is better.
Let’s start with a clear, comparable statistic: female life expectancy at birth in the same year.
In 2022, women were expected to live 79.3 years in Ohio versus 86.8 years in Hong Kong—a 7.5-year gap of shortened lifespan.(5,6)
That’s crazy. Imagine if you had roughly 8 more years to live?
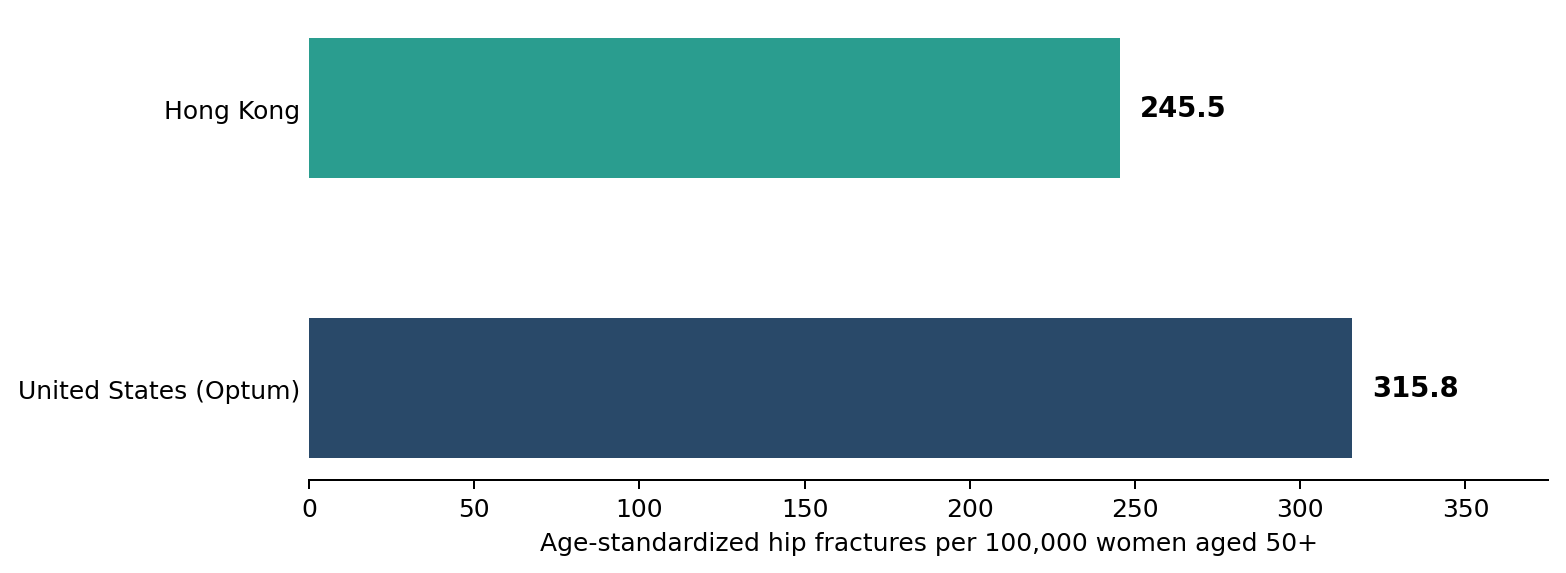
Figure 2. Female hip-fracture incidence (ages 50+), standardized within the same international study. U.S. Optum and Hong Kong datasets cover somewhat different study periods. Sing et al., 2023.9. Higher is worse.
Let’s go beyond the numbers and think about function, too. Specifically moving and falling.
In 2023, approximately 26.7% of Ohio adults aged 65 or older reported a fall in the previous year. Hong Kong’s Elderly Health Centres reported 15.7% among approximately 35,000 community-dwelling attendees aged 65 or older.(7,8) That’s a pretty big difference in function and risk considering that falls are the leading cause of injury-related death among U.S. adults aged 65 and older!
And what about bones? An international study published in 2023 compared hip-fracture rates; among women aged 50 or older, the U.S. Optum population experienced approximately 316 hip fractures per 100,000 women, compared with 246 in Hong Kong—about 29% higher in the U.S. sample.(9)
Think about what fracturing a hip looks like: hospitalization, disability, losing independence, frantically trying to figure out what you or your family will do, etc. That’s a lot.
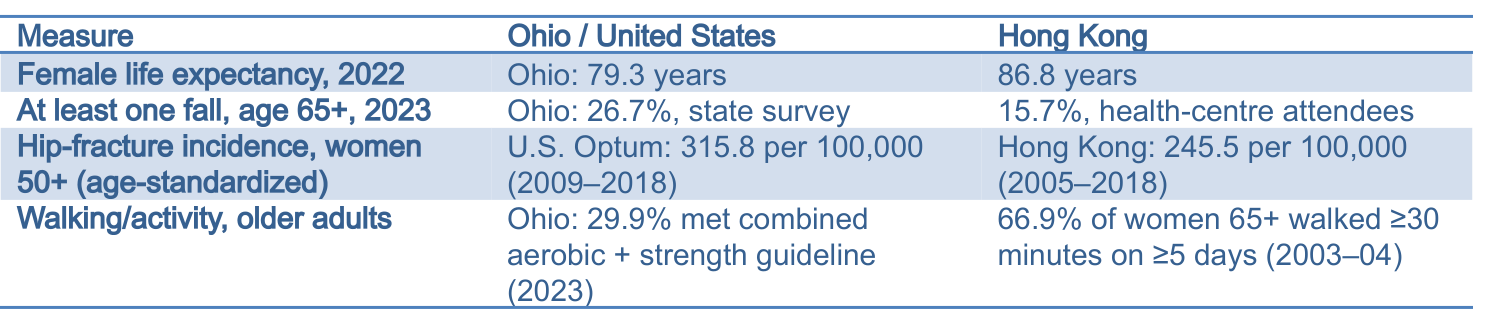
Table 1. Selected health outcomes and activity indicators. Female life expectancy uses the same year; hip-fracture rates are age-standardized using a common reference population in the 2023 international study. Falls and physical-activity statistics come from different surveys and are descriptive.5–11
We’ve talked about shorter lifespans, more falls, and more fracture. Let’s compare the day to day: walking.
One historical survey found that two-thirds of Hong Kong women aged 65 or older walked at least 30 minutes on five or more days a week.(10,11)
Ohio data show that fewer than one-third of all older adults met a more demanding combined aerobic-and-strength guideline in 2023.(10,11) The concern here is whether our environment encourages us to walk and move enough.
I’ve been there! And man - it’s a pain! Don’t get me wrong, it’s refreshing to know you can get by most places out of the US without ever needing to set foot in a car. But until you adapt to walking every day, your body is going to tell you it’s having a terrible time. And that’s kind of the whole point to all of this. Adaptation.
I’ve seen older women in Hong Kong doing physically demanding jobs, including cleaning and public works. Those experiences make me question what we assume older bodies can do. Over there, it’s a pretty meat-heavy, high-fat diet, that to be honest is pretty bad. I love the food. But the thing is they can probably justify it, we can’t and it shows in pure numbers.
So the idea here is, if I transplanted you over there and forced you to live a life that requires movement, lifting, activity, etc. Your health would likely objectively improve. The difficult becomes mundane and your body adapts. So where you live, how you move, what you eat, and what your community makes easy or difficult can influence your health and lifespan. Your surroundings and the people around you influence what feels and is acceptably normal.
The video here is completely normal life overseas. I’ve seen it in person and it is absolutely as ridiculous as it looks. Can you imagine that amount of function, at that age? Can you imagine a community that is agreeable to preserve health in such a way? If you were born before the early 90’s, you might feel a bit of nostalgia with how nonchalant everyone is about meeting, exercising, and third spaces.
Normal Is Not Necessarily The Middle
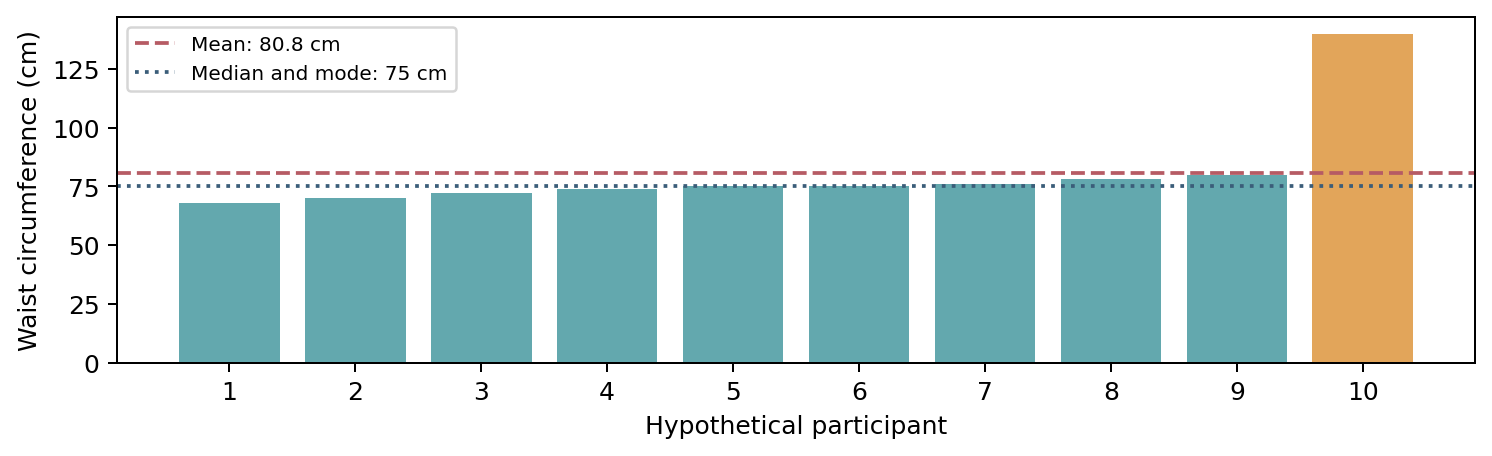
Figure 3. Hypothetical values illustrate how an outlier changes the mean without changing the median or mode. In other words, the middle and the most common stay the same, but the average is skewed higher.
Let’s talk statistics. You hear “average” or “the mean” all the time.
Mean- you take all the numbers you have and then add them up, and divide that total by how many you added.
Median actually means the middle number. So line them all up smallest to largest and it’s the one exactly right in the middle.
Mode is the most frequent number that shows up.
Imagine measuring ten adults and their waist circumferences: 68, 70, 72, 74, 75, 75, 76, 78, 80, and 140 centimeters.
Look, 75 cm is the most common. That one’s the mode. There’s two 75s, right?
The middle is also 75 cm when you line them all up. That’s the median.
But when we’re talking about the average (aka the mean), we need to add them all up, then divide.
So now, that one big value (140cm), pushed the entire average up, which is now 80.8 cm.
Looking at the graph, if your doctor said, “your waist is below average (80.8 cm)! Don’t worry about it.” But in reality, 75 cm might actually be a better goal than what the doctor said.
Do you see how they may not necessarily be putting you in the best outcome and that others are influencing where you might be better off?
These are called “Measures of Central Tendency,” and it’s hard to pick what “normal” should be.
If it’s very common (the mode) to be overweight, does that make it healthier or more acceptable?
If most of your local community has larger waist circumferences compared to the town next door, and you’re average for your community, should you try to match the town next door? Which is healthier?
If the entire population of a country is drastically more sedentary and gains weight due to lack of public transportation and healthy food options, then that means our normal has shifted. If you have guidelines developed with this in mind and you were healthier than most, “that normal” would be worse than yours!
That’s why the numbers matter. For example, body mass index is a terrible measure. Using only weight and height, it doesn’t distinguish between a muscular athlete (muscle ways more than fat) vs someone with little muscle but excess abdominal fat.
You have to choose the right tests - for example, instead of BMI, pair it with a Waist-to-Height Ratio. It adds context to health. If your Waist divided by your Height (ratio) is below approximately 0.5, this gives you a reasonable screening for cardiovascular health.(12) Basically, what it’s saying is try to keep your waist under half your height!
It’s Not About Snapshots, It’s About The Whole Video! (One Lab Value vs The Trend Over Time)
Consider a patient whose A1c blood work is 5.6%.
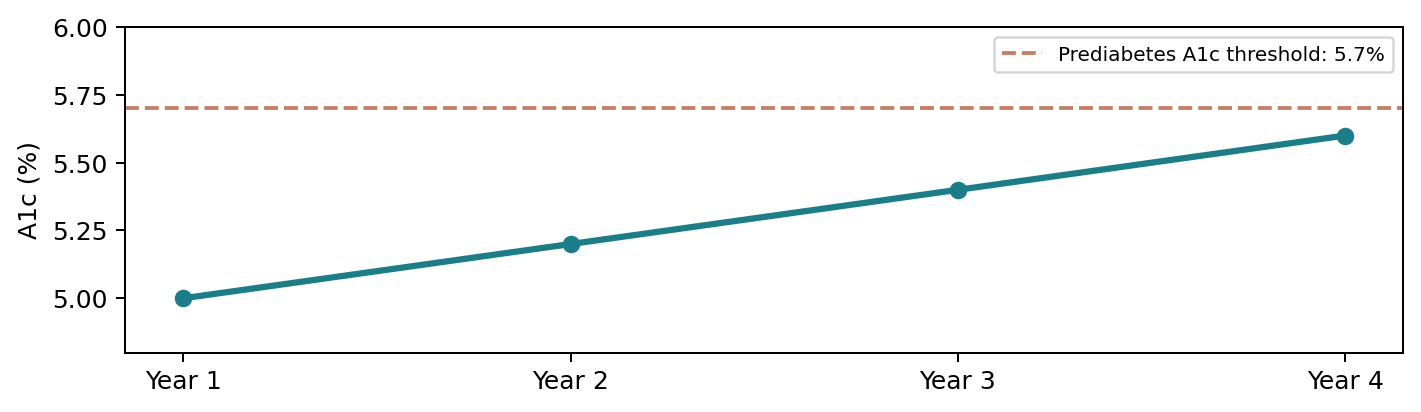
Figure 4. Hypothetical A1c trajectory. A steady increase can be clinically relevant even before a diagnostic threshold is crossed.
What’s an A1c?
A1c measures the proportion of hemoglobin in your red blood cells that has glucose (sugar) attached to it, reflecting roughly the past 2–3 months. Your blood roughly lasts about 3 months before it’s replaced with new blood. So if you eat a lot of sugar, your blood cells have a lot of sugar stuck on them like dog fur stuck on socks you replace every 3 months.
So it’s 5.6%. Under the American Diabetes Association criteria, prediabetes begins at 5.7% and diabetes at 6.5%(13). Technically, 5.6% does not meet the A1c criterion for prediabetes.
Your doctor tells you, “you got away with it this time!” or “don’t worry, you're not diabetic.” You feel uncertain. You see a different doctor.
This one digs back and finds the trend: 5.0% three years ago, then 5.2%, then 5.4%, and now 5.6%.
What do you think will happen in one year? Two? What happens when your doctor starts you on a medicine after you cross 6.5%? The number goes back down, right?
The medicine fixed the problem for now. You’re back down to 5.7%
Next few visits. It’s climbing again. What happens when your doctor starts you on another medicine? The number goes back down, right?
The medicine fixed the problem for now. You’re back down to 6.1%
Next few visits. It’s climbing again. What happens when your doctor… Rinse and repeat.
This is the frustration I have with our food-medicine-industrial complex. Our medical system is set up to reward 5 minute visits, pill pushing, and poor education. People are overworked and forced to choose the most convenient and unhealthy of foods, then started on medicines like they’re the quick fixes. Temporary bandages until it is death by a thousand cuts.
If we had started 3 years ago and had a genuine discussion about what time you’re sleeping, the quality of sleep, meal times and dinner sizes, how fast you’re eating or how predigested/processed your food is, exercise, stress, other medication reactions, etc. You likely would not have even needed medicine.
The goal has always been to educate so that you can remove medicine where possible. But that’s not rewarded in this system.
The numbers and trends don’t lie, they really just frame the bigger picture that lifestyle intervention is the only treatment for a society and infrastructure that demands our health and wellness in payment.
In the Diabetes Prevention Program, an intensive lifestyle intervention aimed at weight loss and at least 150 minutes of activity each week reduced diabetes incidence by 58% relative to placebo in adults already at elevated risk.(14) It really works; it’s just not sexy like the next injectable medication or possible with some of our jobs.
What Should You Actually Aim For Then?
Let’s not chase numbers. Let’s chase function. Labs and metrics will follow. The trends direct you on what to do or show how effective you are.
Here are some basic recommendations to start with. Do you match this? It’s a good starting line. If you’re beyond, keep going. If not, keep working toward it!
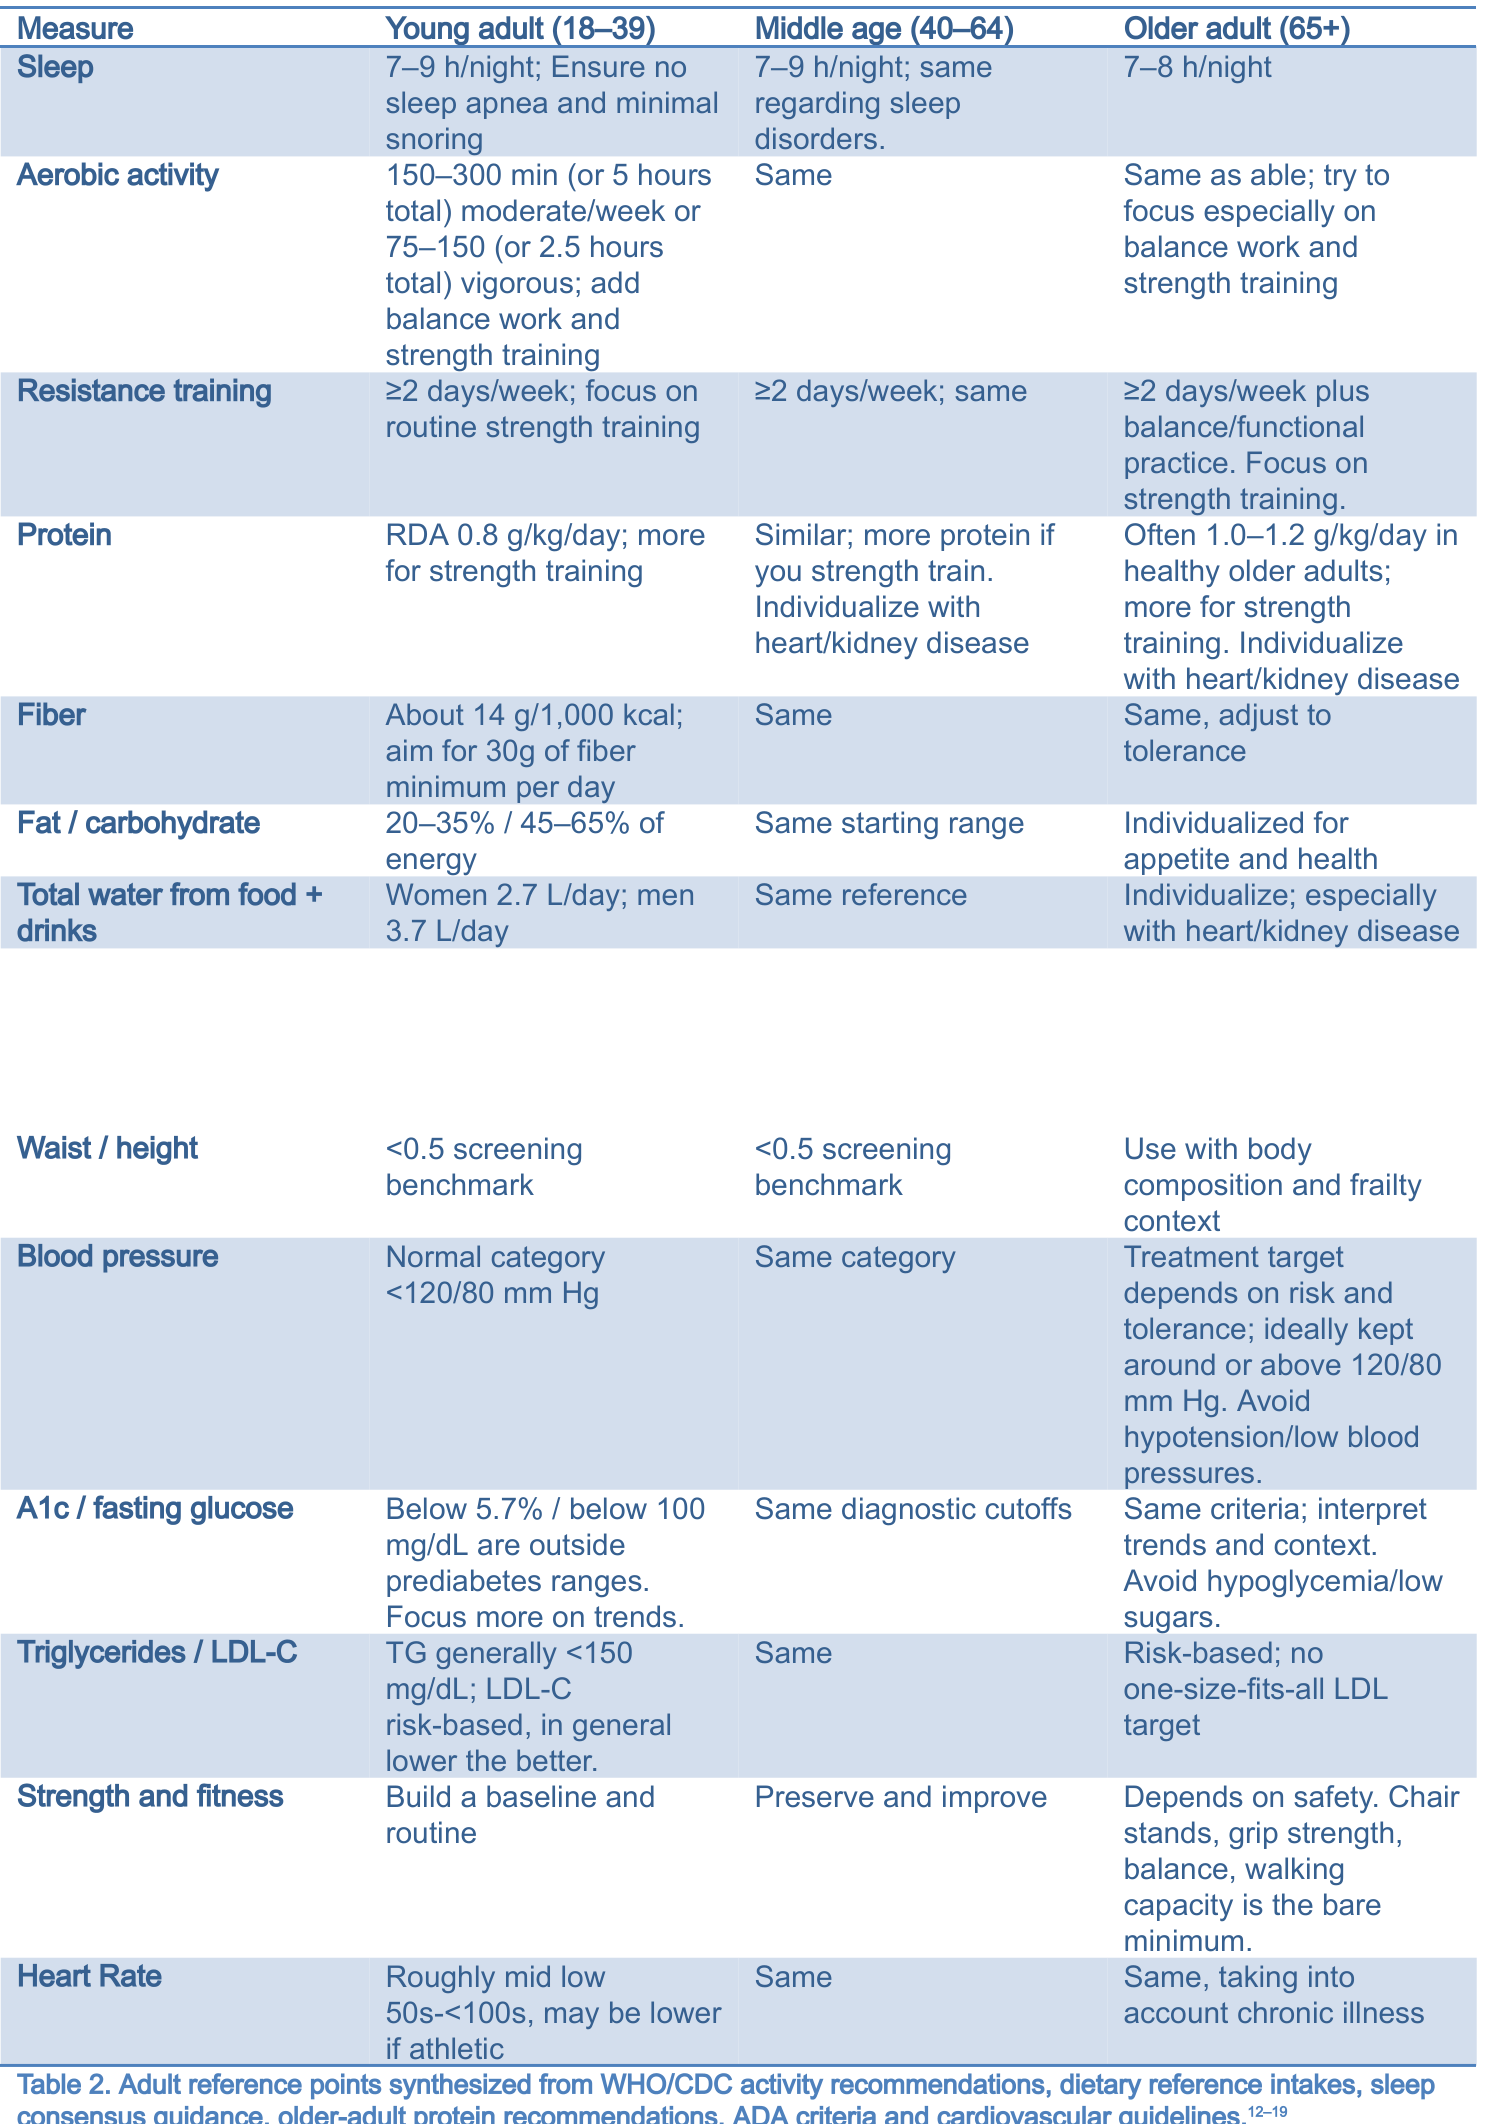
Table 2. Adult reference points synthesized from WHO/CDC activity recommendations, dietary reference intakes, sleep consensus guidance, older-adult protein recommendations, ADA criteria and cardiovascular guidelines.12–19
The Hard Questions
It’s difficult to individualize things like neck circumference, body-fat percentage, squat weight, etc. Even labs like omega-3:6 ratios, blood count levels, iron, and so forth. These are all very individualized but the trends are the most important just like the function. These also vary by height, sex, etc.. Even body image varies by culture! There is no one size fits all.
Pick! Mean, Mode, or Median. What is your goal from there?
Am I functional? Then follow-up with can I be more functional in 3 months? If the answer is yes, then a plan needs to be put in place.
Do I like where I am at and how I look? How much more consistent work am I willing to compromise with? Will my current lifestyle even allow for what I want?
There are some tests that can screen you quickly for function, for example grip strength and chair-rise testing can help screen for low strength. European sarcopenia (muscle loss) guidance uses grip-strength cutoffs below 27 kg for men and 16 kg for women as markers of low strength(20) Cardiorespiratory fitness, measured by VO₂ max, also declines across age groups in population data, but what counts as excellent at age 30 differs from age 75 and from one sex to another.(21)
Nutrition, too. You’ll need to account for what makes you, you. For a 70-kg older adult, 1.0–1.2 g/kg of protein means 70–84 grams per day; severe kidney disease may change that recommendation. The fiber guideline is roughly 28 grams on a 2,000-calorie diet. Total-water recommendations include drinks and food. (15–18) If you don’t have an appetite, or if you’re smaller, you’ll need to change this. If your culture or choice is to avoid meat, then you’ll need to find ways to compensate as well. It’s all very individualized, so it’s best to go by function and form while watching the trends.
The Unexpected Consequences
Let’s say, our doctor told us to lose weight. We’re too busy with work, but he prescribed a GLP and now a lot of weight has come off. He says, great! Unfortunately, that’s not the whole picture.
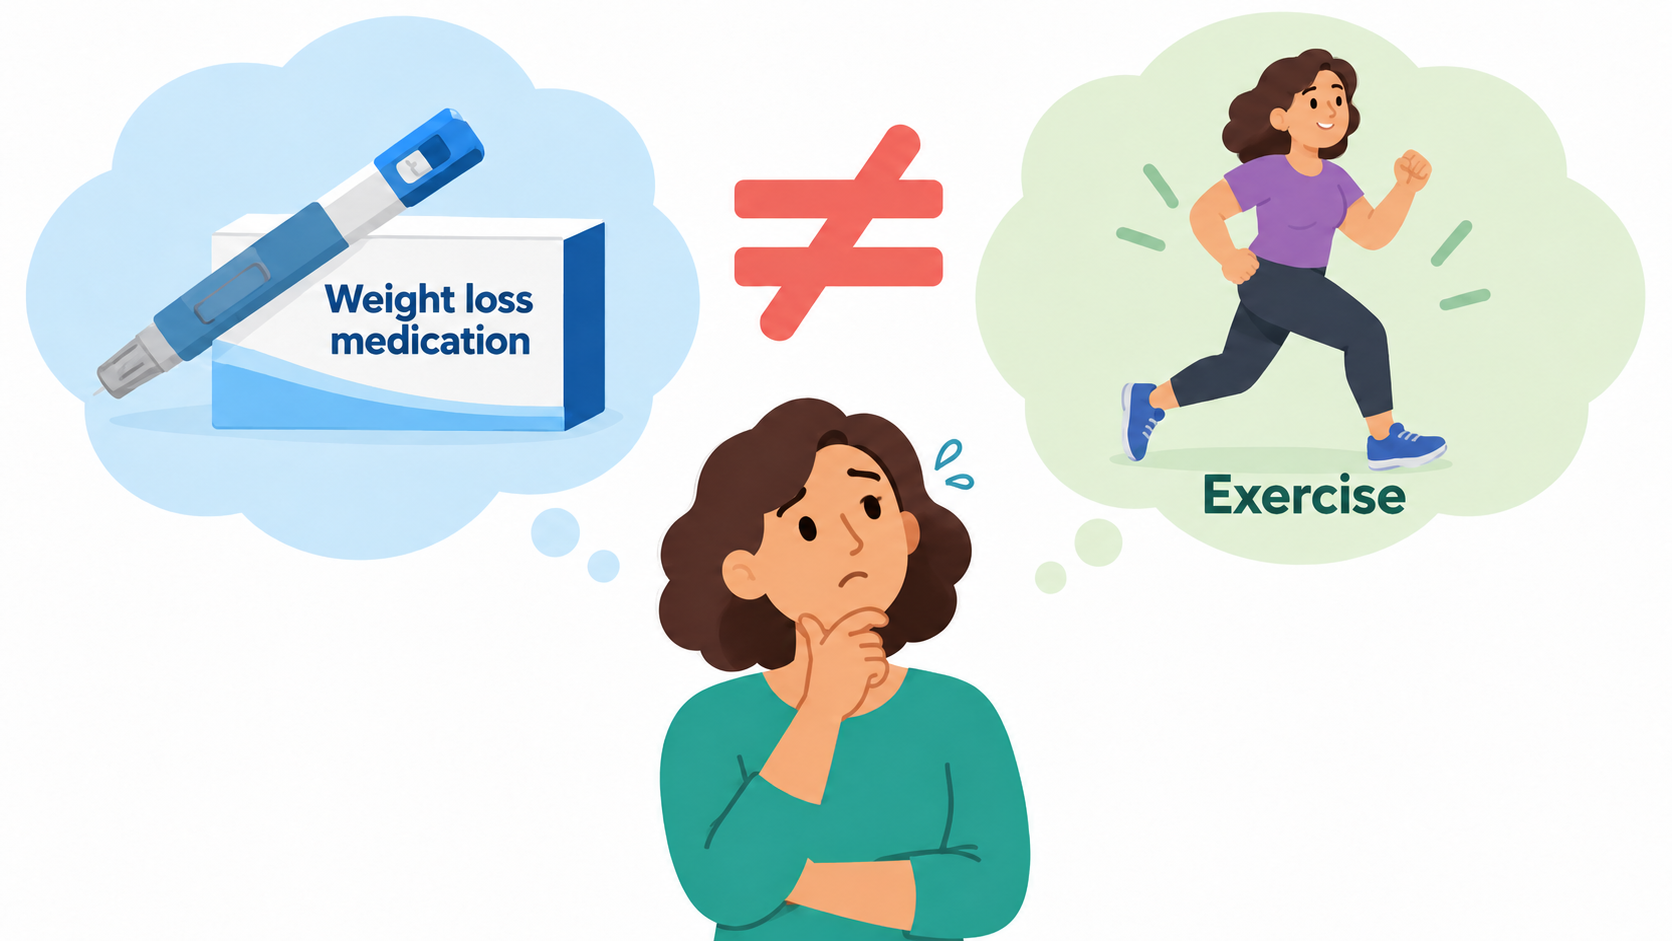
When changes happen too quickly and the body changes with only medication and not the supporting framework around it like exercise, things get complicated.
To the untrained eye, everyone sees weight loss but experienced physicians know the risk.
Someone with a higher body mass actually holds greater bone mineral density and in some cases lower hip-fracture risk. Weight loss without accompanying exercise can reduce lean mass and bone mineral density, potentially affecting fracture risk. (22)
On top of that - no one ever talks about the increased cardiovascular risks. Sure, you hear everyone talking about how GLPs made them lose weight and how it decreases their cardiovascular risks. But, no one even talks about the rebound and fluctuation risks.
If you gain the weight back and continue with the weight fluctuations, it is associated with a 1.41-times higher risk of all-cause mortality (death) in observational studies of weight cycling.(23) So to use this medication alone is just asking for trouble if you don’t have a structured plan.
Blood pressure offers another example. The SPRINT randomized trial showed that intensive blood-pressure treatment reduced cardiovascular events and mortality among selected high-risk adults, but it also increased hypotension among other adverse events(24) So with this said, we really should try to improve people’s blood pressures!
But when you have an older patient already dizzy, falling, maybe frail, or taking other medications causing side effects - what do you think is better? Hitting a blood pressure goal to reduce cardiac risk or making it safer for them by increasing function, muscle, etc. The second option ultimately also reduces their blood pressure too!
Medications can be essential, but they are not a substitute for building sustainable habits and maintaining function. Like the body adapts to activity, it adapts to medicine and may become less effective. It’s important to really hone in on “Low and slow with as little [medications] needed to go.” Changes are slow. Normal is slow.
It’s about risk reduction while maximizing function for quality of life.
Ask Better Questions About “Normal” Bloodwork
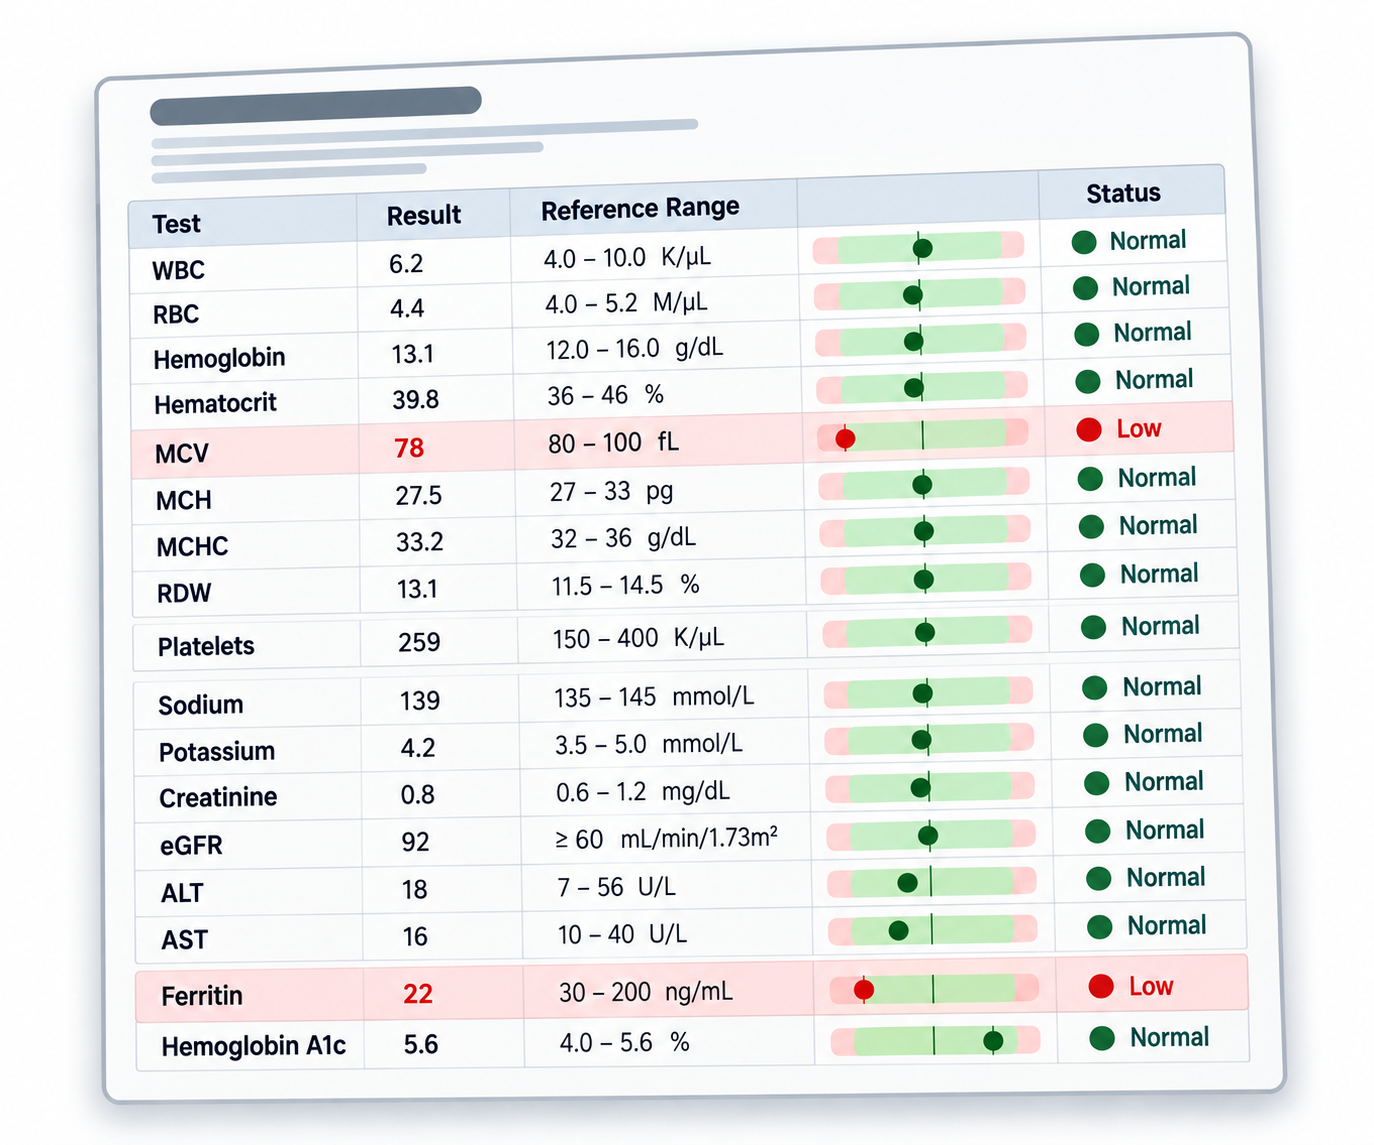
Laboratory “normal ranges” often describe values found in a selected reference population. A common reference interval covers the central 95% of that population. That is not the same as a disease threshold, and neither is automatically an ideal treatment target.
If you think about anemias or the better way to think about it, “low blood,” many doctors don’t pick up on the trends that occur before you’re truly diagnosed with anemia.
Everyone looks at “hemoglobin.” “Oh great, it’s normal!” There’s more to it though.
Better trained physicians may look at the sizes of your blood cells (Mean Corpuscular Volume or MCV) and notice they’re getting smaller.
In other words, you can’t make good quality sized blood if you don’t have the resources, right?
Some check your ferritin (stored iron, but be careful this increases during some infections) or iron.
So in the example you see on the right, if you only went by Hemoglobin, you evaded the cutoff. But if you asked your doctor about the trends, they would notice “oh you’re not making good blood. I need to look more into this…” This person is on their way to anemia.
Bonus points, the example here also notes that this person is prediabetic! Another cutoff that was evaded.
Remember how A1c is a 3 month average of sugars stuck on your blood? Well if your blood is small, then it makes it look like less sugar is stuck on. Again, smaller socks means less dog fur stuck on them. So it’s actually more sugar than you think!
So, ask about the trend. Don’t wait for values to cross a lab value cut-off number. Have someone walk you through what things mean.
Let’s make the above example even more interesting. Suppose this person has bad reflux and the person has been on long-term acid-suppressing medications.
Ask about the side effects! This is an example of someone that never changed their diet, a previous provider put them on a stomach acid suppressing medication for years, forgot about it and kept refilling it.
And what happened? Stomach acid medications block iron absorption and also block magnesium absorption. Long term use is associated with diabetes and anemias as well as magnesium deficiency (magnesium influences how your insulin for blood sugars work). And unfortunately, the person slowly became anemic and prediabetic. Luckily there wasn’t a bigger problem like an ulcer or colon cancer.
Seriously, the next time you’re with your doctor. Ask them about the trends. Ask them about side effects. Ask them what to expect. You’re paying for their time so you should walk away with the education.
So What Is Normal?

Look at everyone around you locally vs globally. Understand where the middle is, what is most common, and what’s average. That’s step one.
Look at what you want. That’s step two.
Look at where you’re going (trends). That’s step three.
Look at what happens if you do nothing versus if you do something. Use my personal rule of 3’s. 3 days, 3 weeks, 3 months, 3 years. That’s the last step.
Don’t become weaker just because everyone aging is becoming weak. That’s not normal. If everyone around you has increased waist circumference, don’t accept that it’s normal. If you’re approaching cut offs, don’t wait until you cross over to do something about it. The damage is already being done while you’re trending toward that direction.
Don’t wait to be diagnosed. Anticipate the diagnosis.
The goal is to preserve function at the expense of how much effort you want to spend. Decide what matters to you and only focus on consistency.
That’s the secret to longevity and functional independence.
And that should be the normal.
References
1. Volpi E, Nazemi R, Fujita S. Muscle tissue changes with aging. Curr Opin Clin Nutr Metab Care. 2004;7:405–410.
2. Mitchell WK, et al. Sarcopenia, dynapenia, and advancing age: quantitative review. Front Physiol. 2012;3:260. https://doi.org/10.3389/fphys.2012.00260
3. Goodpaster BH, et al. Loss of muscle strength, mass, and quality in older adults. J Gerontol A. 2006;61:1059–1064. https://doi.org/10.1093/gerona/61.10.1059
4. Sherrington C, et al. Exercise for preventing falls in older people living in the community. Cochrane Database Syst Rev. 2019;CD012424. https://doi.org/10.1002/14651858.CD012424.pub2
5. CDC National Center for Health Statistics. U.S. State Life Tables, 2022, Table A. https://www.ncbi.nlm.nih.gov/books/NBK620280/
6. Hong Kong Census and Statistics Department. Women and Men in Hong Kong: Key Statistics, 2025 edition (2022 female life expectancy). https://www.censtatd.gov.hk/en/wbr.html?ecode=B11303032024AN24
7. America’s Health Rankings. Falls—Age 65+, Ohio, 2023 BRFSS. https://www.americashealthrankings.org/explore/measures/falls_sr/OH; CDC older-adult fall deaths: https://www.cdc.gov/falls/about/index.html
8. Hong Kong Department of Health, Elderly Health Service. Fall Prevention; 2023 centre-attendee statistics. https://www.elderly.gov.hk/english/healthy_ageing/healthy_living/falls.html
9. Sing CW, Lin TC, Bartholomew S, et al. Global epidemiology of hip fractures: secular trends in incidence rate, post-fracture treatment, and all-cause mortality. J Bone Miner Res. 2023;38(8):1064–1075. https://doi.org/10.1002/jbmr.4821
10. America’s Health Rankings. Exercise—Age 65+, Ohio, 2023 BRFSS. https://www.americashealthrankings.org/explore/measures/exercise_sr/OH
11. Hong Kong Department of Health. Population Health Survey 2003–2004; walking among elders 65+. https://www.change4health.gov.hk/en/physical_activity/figures/elder/index.html
12. NICE. Overweight and obesity management. NG246. https://www.nice.org.uk/guidance/ng246
13. American Diabetes Association. Diagnosis and classification of diabetes: Standards of Care in Diabetes—2026. Diabetes Care. 2026. https://doi.org/10.2337/dc26-S002
14. Knowler WC, et al. Reduction in incidence of type 2 diabetes with lifestyle intervention or metformin. N Engl J Med. 2002;346:393–403. https://doi.org/10.1056/NEJMoa012512
15. World Health Organization. WHO Guidelines on Physical Activity and Sedentary Behaviour. 2020. https://www.ncbi.nlm.nih.gov/books/NBK566046/
16. Bauer J, et al. Evidence-based recommendations for optimal dietary protein intake in older people. J Am Med Dir Assoc. 2013;14:542–559. https://doi.org/10.1016/j.jamda.2013.05.021
17. Institute of Medicine. Dietary Reference Intakes: Energy, Carbohydrate, Fiber, Fat, Protein and Amino Acids. 2005. https://nap.nationalacademies.org/catalog/10490/
18. Institute of Medicine. Dietary Reference Intakes for Water, Potassium, Sodium, Chloride, and Sulfate. 2005. https://nap.nationalacademies.org/catalog/10925/
19. CDC. Older Adult Activity: An Overview. 2025. https://www.cdc.gov/physical-activity-basics/guidelines/older-adults.html
20. Cruz-Jentoft AJ, et al. Sarcopenia: revised European consensus on definition and diagnosis. Age Ageing. 2019;48:16–31. https://doi.org/10.1093/ageing/afy169
21. Kaminsky LA, et al. Reference standards for cardiorespiratory fitness: FRIEND registry. Mayo Clin Proc. 2015;90:1515–1523. https://pmc.ncbi.nlm.nih.gov/articles/PMC4919021/
22. Villareal DT, et al. Weight loss, exercise, or both and physical function in obese older adults. N Engl J Med. 2011;364:1218–1229. https://doi.org/10.1056/NEJMoa1008234
23. Zou H, Yin P, Liu L, et al. Body-weight fluctuation was associated with increased risk for cardiovascular disease, all-cause and cardiovascular mortality: a systematic review and meta-analysis. Front Endocrinol (Lausanne). 2019;10:728. https://doi.org/10.3389/fendo.2019.00728
24. SPRINT Research Group. A randomized trial of intensive versus standard blood-pressure control. N Engl J Med. 2015;373:2103–2116. https://doi.org/10.1056/NEJMoa1511939